Overview
ONE - Data Analysis lets you import CSV, Excel, or BLF (CAN) files, choose columns, and build multi-panel plots with shared or independent axes. You can zoom, pan, set a crosshair by clicking, add cursors, define events and annotations, and export sessions or images. Large datasets are downsampled for smooth interaction. Use the feedback form at the bottom of the main page to send bug reports or feature requests.
App header
The header shows the app title on the left and the ONE logo on the right. Use the User Manual link to open this page.

Import file
Use the Import file card in the left sidebar to load your data.

- CSV / Excel / BLF — Click to choose a .csv, .xlsx, .xls, or .blf file. For Excel, you can switch sheets from the dropdown after load.
- Add columns from CSV — After loading data, add more columns from another CSV by merging on the X axis. Choose columns to import or add to the current dataset.
- Large CSV — For big files you can import the first 500,000 rows, load the full file, or open a column picker to select which columns to import.
- BLF — For CAN log files: select channels to decode and assign a DBC file to each, then click Decode BLF.
- Export session — Downloads a JSON file with current data and layout (panels, axes, ranges). Use this to share a full session.
- Import session — Load a previously exported session JSON to restore data and plot setup.
- Export layout preset / Apply layout preset — Save or load only the layout (no data), so you can reuse the same panel/axis setup on new files.
Signals card and adding to chart
After loading a file, the Signals card lists all numeric (and derived) columns. Select the X axis, pick columns, choose a panel, and add them to the chart.

- X axis — Use the radio buttons or dropdown to set which column is the horizontal axis (e.g. Time).
- Select columns — Check the columns you want to plot. Use search to filter the list.
- Panel — Choose which panel the new series will go into.
- Add to chart — Adds the selected columns to the chosen panel. Each series is assigned to that panel's first axis by default.
Panels
Panels are stacked chart areas. You can add panels, rename them, assign series to axes, and move series between panels.

- + Add panel — Creates a new panel below the existing ones.
- Each panel has one or more Y axes (left/right). Use the panel editor to assign each series to an axis or move it to another panel.
- Panel height can be adjusted by dragging the resize handle at the bottom of each chart area.
Axis ranges
Control X and Y axis limits and labels from the Axis ranges card.

- X min / max — Set the horizontal range. Auto fits the full data range.
- Y min / max — Set ranges for each Y axis. Auto per axis fits that axis's series.
- You can override axis labels (e.g. custom units or titles) in the same card.
Interacting with the plots
All interaction happens over the chart area and axes.

- Scroll (wheel) — Pans the chart along the axis under the cursor (X if over the plot or X axis, Y if over a Y axis).
- Ctrl + scroll (or Cmd + scroll on Mac) — Zooms in or out around the cursor. Same rule: over a Y axis zooms that axis only; over the plot or X axis zooms X.
- Box zoom — Click and drag on a chart to draw a rectangle; on release, the X axis and all Y axes in that panel zoom to the selected region.
- Double-click X axis — Fits the full data range on the horizontal axis. Double-click a Y axis — Fits that axis to the data in the current X view.
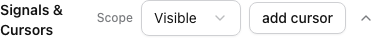
- Click — Sets the crosshair at that X value. Press Enter to clear the crosshair. To add a cursor: click "add cursor" in the Signals & Cursors card, then click on the chart where you want the cursor.
- Cursors — Add cursors from the Signals & Cursors card. Click "add cursor", then click on the chart to place a cursor; move by dragging a cursor on the chart, or select one and use ← / → to move by one sample. Double-click a cursor's X value in the list to type a new X (values snap to the nearest data point). Escape to deselect or cancel add mode.
Signals and cursors
When at least one series is plotted, the Signals & Cursors card shows min, max, mean, std, and count for the visible or full range, plus a list of cursors and their values. You can toggle individual cursor columns (c1, c2, etc.) and individual delta columns for each cursor pair. Click "add cursor" then click the chart to add a cursor, type a new X to move (snaps to nearest data point), drag on the chart, or use arrow keys when one is selected.
- Signals & Cursors — Toggle columns (min, max, mean, std, n), individual cursor columns (c1, c2, etc.), and individual delta columns for each cursor pair. Click a signal name to change its line color, point style, point size, and line width on the chart. The card also lists all cursors with editable X; click "add cursor" then click the chart to add, show/hide on chart, select for arrow-key move, or double-click X to type a new value (snaps to the nearest data point).
Export and report mode
Buttons above the plot area let you export data or an image and switch to report-friendly styling.

- Report mode — Toggles larger fonts and thicker lines for presentations or PNG export.
- Export CSV — Downloads the visible (or full) data range for the plotted columns.
- Export PNG — Captures the current plot area as a PNG image.
Annotations
The Annotations card lets you add vertical (X) or horizontal (Y) reference lines with optional labels. Choose a panel or "All panels" for vertical lines. Useful for events or thresholds.
Derived columns
The Derived columns card lets you define new numeric columns with formulas. Use column names and operators: + - * / or diff(ColName) for sample-to-sample difference. Examples: A + B, Velocity * 3.6, diff(Time). Derived columns appear in the Signals list and can be plotted like any other column.
Event detection
The Event detection card lets you define events with formulas (e.g. rising_edge(), comparisons with <, ==, >=, AND, OR). Each event has a name, formula, and X window size. Detected events are marked on the chart. You can drag signal names from the Panels card into the formula field. Events are included in session export and layout presets.
Performance and large data
Large datasets are downsampled (e.g. to tens of thousands of points) for smooth pan and zoom. The visible range and full data are used for cursor values and statistics. For very large CSV files, use the column picker or "Import first 500,000 rows" / "Load full file" as needed.
Feedback
At the bottom of the main Data Analysis page, a Site feedback card lets you submit feature requests or bug reports. Use the form to send feedback; you can also open "View all feedback" to see existing items (when the feedback API is deployed).
Updating screenshots
Screenshots in this manual are stored in public/manual/. To regenerate them after UI changes, run from the plotter directory: npm run capture-screenshots. The script starts the dev server if needed and saves images to public/manual/.